Ab3d.DXEngine Users Guide
Diagnostics
Ab3d.DXEngine provides great analysis and diagnostics support.
The diagnostics tools can be used for the following purposes:
- Optimize rendering performance with checking the rendering timers, number of draw calls, number of state changes and similar statistics.
- Allow using advanced customizations of rendered objects with providing insight on how DXEngine renders the 3D scene. This can be get with inspecting the DXEngine SceneNodes, RenderingQueues and RenderingSteps.
- Diagnosing problems when rendering 3D scene.
A simple way to diagnose the DXEngine is to use Visual Studio debugger and inspect many of the properties on the DXViewportView and DXViewportView.DXScene objects.
DXScene object also provides the following methods to get additional details about the 3D scene: DumpSceneNodes, DumpRenderingQueues, GetSceneNodesDumpString or GetRenderingQueuesDumpString.
Advanced diagnostics with a lot of data and options is provided with using the DXEngine Diagnostics window that is defined in the Ab3d.DirectX.Client.Diagnostics project (available with full source code).
You have two options to use the Diagnostics window. One option is to include the Ab3d.DirectX.Client.Diagnostics project into your application.
The other option is to use DXEngineSnoop tool.
To include the Ab3d.DirectX.Client.Diagnostics project into your application, add reference to the Ab3d.DirectX.Client.Diagnostics project and then add code to create and show an instance of DiagnosticsWindow object.
When creating the DiagnosticsWindow object, you need to pass your DXViewportView as parameter. This approach is also used in the main Ab3d.DXEngine samples project where user can click on "Diagnostics" button to open the Diagnostics window.
The other option to show Diagnostics window do not require any change of your application.
With using the DXEngineSnoop application you can attach to
a running application that is using Ab3d.DXEngine and open the Diagnostics window on the running application.
The DXEngineSnoop is installed with the evaluation or commercial installer into the Ab3d.DXEngine\Tools folder.
It can be also downloaded from Ab3d.DXEngine.Wpf.Samples tools folder on GitHub or by clicking on the following button:
See DXEngineSnoop section below for more info.
Using Diagnostics window from the Ab3d.DirectX.Client.Diagnostics project
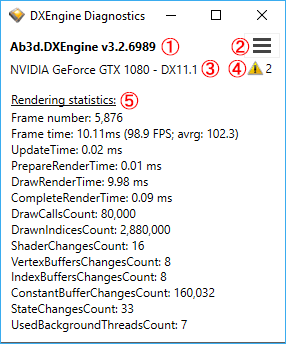
The following screenshot shows Diagnostics window from the Ab3d.DirectX.Client.Diagnostics project:
 (Note: all screenshot are from Ab3d.DXEngine version 2.1.6162; the actual controls can change in the future versions)
The red annotations show 5 main areas of the Diagnostics window:
- Version of the Ab3d.DXEngine library.
- Menu with additional actions and options (see Diagnostics menu below).
- Name of the currently used adapter (graphics card); used DirectX feature level (11.1 in this case); in case when DirectX device is created with debug flag, then "(debug layer)" text is displayed after the feature level.
- Warning and error messages info icon and number of messages (shown only when any warnings or errors occur). In case DXEngine logs a warning or error (for example if no camera is defined or if MeshGeometry3D have invalid TriangleIndices), then in icon with number of messages is shown. When clicking on the icon, a new window is opened with all messages shown. If the 3D scene is not rendered as expected, then a warning or error may indicate a reason for that.
- Rendering statistics (see below).
Rendering statistics details
The following rendering data are provided:
- Frame number: number of the frame.
- Frame time: time in ms that was needed to update and render the frame. The numbers in brackets show theoretical FPS (frames per seconds) if application could render as many frames as possible (usually WPF applications are limited to 60 FPS) and if all the CPU time was used only for DXEngine rendering.
- UpdateTime: time in ms that was spent in the DXScene.Update method (checking all SceneNodes for changes).
- PrepareRenderTime: time in ms needed to prepare the frame to be rendered (clear the buffers, initialize render targets and states, etc).
- DrawRenderTime: time in ms needed to draw all objects for this frames (calling Draw methods and any needed state change methods).
- RenderShadows: time in ms needed to render shadow maps (shown only when rendering shadows).
- CompleteRenderTime: time in ms needed to complete the rendering (resolve anti-aliasing, resolve stereoscopic images, calling Present on SwapChain or Flusing device for shared texture).
- PostProcessingRenderTime: time in ms needed to render all post processing effects.
- HitTestingTime: total time in ms needed for DXEngine hit-testing for all frames in the last 1 second (shown only when hit testing is performed).
- DrawCallsCount: number of draw calls in this frame. Note that because each draw call require some work on the CPU, the large number of draw calls (many thousands) can significantly limit the performance. This makes this value one of the most significant values when optimizing performance. When using DirectX command caching, then this value shows the number of draw calls made by DXEngine. To get the total number of draw called executed by DirectX add the value of CachedRenderedObjects to this list.
- DrawnIndicesCount: number of drawn triangle indices in this frame.
- ShaderChangesCount: number of times shader was changed in this frame.
- VertexBuffersChangesCount: number of times vertex buffer was changed in this frame.
- IndexBuffersChangesCount: number of times index buffer was changed in this frame.
- ConstantBufferChangesCount: number of times constant buffer was changed in this frame.
- StateChangesCount: number of state changes in this frame.
- CachedCommandLists: number of cached commands lists compared to all used command lists (shown only when DirectX command list caching is enabled).
- CachedRenderedObjects: number of cached draw calls - those draw calls were created in some of the previous frames and are reused in this frame with almost no CPU time required (shown only when DirectX command list caching is enabled).
- UsedBackgroundThreadsCount: number of background threads used to render the 3D scene (number 7 means that 8 threads are used: 1 main thread + 7 background threads).
- Process CPU usage: percent of the CPU usage spend in this process (100% means that one CPU core is 100% used; so values bigger than 100% are possible when more cores are used). This value is shown only when enabled in the menu (showing the value may affect performance).
Most of the values displayed there can be get from the DXScene.Statistics property. For more information see the source code of the GetRenderingStatisticsDetails method in the DiagnosticsWindow.xaml.cs file.
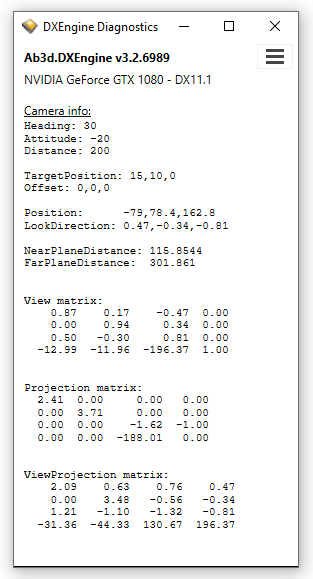
Camera info
The following screenshot shows live camera info (to show camera info check the "Show camera info" option in the menu):
Diagnostics menu
The following screenshot shows opened diagnostics menu:
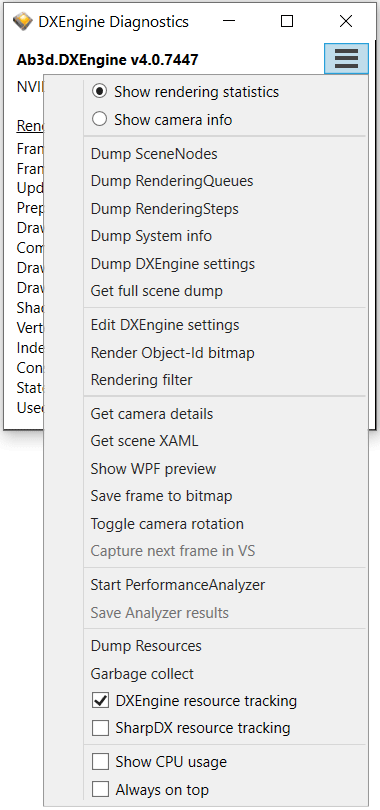
Diagnostics menu provides the following actions and options:
- Show rendering statistics - when checked the Diagnostics window is showing rendering statistics.
- Show camera info - when checked the Diagnostics window is showing current camera information.
- Dump SceneNodes - shows hierarchical structure of SceneNode objects that are crated from WPF 3D objects. The same data can be get at runtime with calling DumpSceneNodes or GetSceneNodesDumpString methods on DXScene object.
- Dump RenderingQueues - shows objects as they are assigned to each RenderingQueue objects. This also shows the order in which the 3D objects are rendered. The same data can be get at runtime with calling DumpRenderingQueues or GetRenderingQueuesDumpString methods on DXScene object.
- Dump RenderingSteps - shows rendering steps that are used to render the 3D scene (defined in DXScene.RenderingSteps collection).
- Dump System info - shows information about the current operating system and all available graphics cards.
- Dump DXEngine settings - shows values of DXViewportView and DXScene properties.
- Get full scene dump - gets detailed information about the rendered scene with including information about system, SceneNodes, RenderingQueues, RenderingSteps, xaml of the current scene and scene bitmap encoded as Base64 string. When there are problems with rendering, please send the full scene dump to support@ab4d.com email.
- Edit DXEngine settings - shows a dialog where it is possible to change some of the DXScene settings - for example number of background thread, DirectX commands list caching, transparency sorting, etc.
- Render Object-Id bitmap - renders the current scene to a bitmap where the colors represent the rendering queue and object index (see "ObjectId rendering" sample for more info).
- Rendering filter - shows a dialog that can be used to disable rendering some RenderingQueues and executing some RenderingSteps.
- Get camera details - shows details about the current camera. This can be very useful when you want to initialize the camera to the same values as the current camera in the scene.
- Get scene XAML - serializes the current Viewport3D and its child objects into XAML string.
- Show WPF preview - serializes the currently shown 3D objects into XAML and shows the XAML in a new window with using WPF 3D rendering - can be used to check the differences between DXEngine and WPF 3D rendering. Note that not all objects can be serialized and may be therefore missing in WPF preview window.
- Save frame to bitmap - renders the scene to bitmap and opens save file dialog to save the bitmap to disk.
- Toggle camera rotation - starts or stops camera rotation (when using camera from Ab3d.PowerToys).
- Capture next frame in VS - when the application is started with "Start Graphics Debugging" in Visual Studio, this action can save the next frame to the graphics debugger. This can be used even when DirectXImage PresentationType is used (in this case it is not possible to capture frame from Graphics debugger). (This works only on Windows 8.1 and Windows 10).
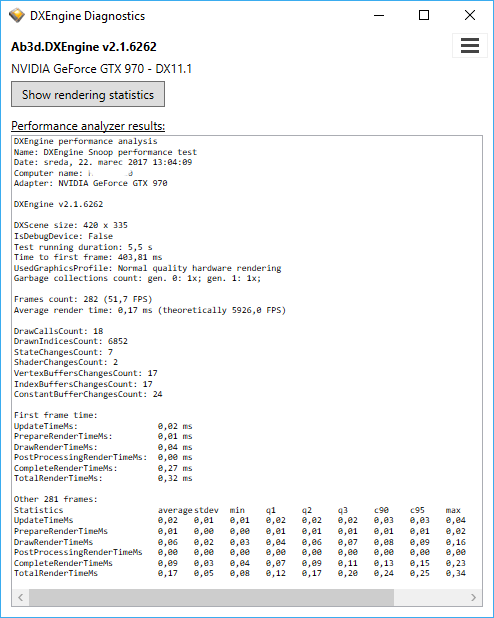
- Start PerformanceAnalyzer - starts performance analyzer that can provide many statistical values (average, min, max, mean, etc.) for rendering statistics. See screenshot below.
- Save Analyzer results - after the performance analysis report was created, you can use this action to save the report to disk.
- Dump Resources - shows the DirectX resources and objects that were created by DXEngine (before any resources can be tracked, the DXEngine and/or SharpDX resource tracking must be enabled with CheckBoxes below).
- Garbage collect - forces a full garbage collection.
- DXEngine resource tracking - enables DXEngine resource tracking.
- SharpDX resource tracking - enables SharpDX resource tracking.
- Show CPU usage - when checked the frame statistics also show CPU usage (this is disabled by default because it takes quite some time to initialize the required performance counters and this delays showing the diagnostics window).
- Always on top - when checked the Diagnostics window is shown always on top of other windows. This can be helpful when your application uses full screen and diagnostics window must be shown on top of your application.
Performance analysis
The following screenshot shows a performance analysis result:
DXEngineSnoop
DXEngineSnoop uses technology from WPF Snoop project (https://snoopwpf.codeplex.com/) that allows attaching to already running .Net application.
When the DXEngineSnoop is attached to the running application, it tries to automatically find the DXViewportView from the visible UI controls.
If the DXViewportView is found, the DXEngine Diagnostics window is shown (defined in the Ab3d.DirectX.Client.Diagnostics project).
The following screenshot shows main DXEngineSnoop window with "Ab3d.DirectX.ShaderFactory" application selected in the main ComboBox control.

In this case the user can click on "SNOOP" button and a Diagnostics window will be shown in the Ab3d.DirectX.ShaderFactory application.
DXEngineSnoop can be starter with "/auto" startup parameter. This will automatically attach to the first .Net application with DXEngine.
This may be very handy because you can get the Diagnostics window quickly.
Troubleshooting DXEngineSnoop
Using DXEngineSnoop is not always possible. When attaching to the target application and trying to show Diagnostics window, many things can go wrong.
For example the DXEngine or SharpDX version may not be compatible.
It is also possible that the DXViewportView is a child of a custom controls that is not recognized by the DXEngineSnoop and therefore the DXViewportView cannot be found.
Though DXEngineSnoop tries to work on many different target environments, sometimes the Diagnostics window is not shown.
In most cases the DXEngineSnoop successfully attaches to the target progress, but then the problems begin when the DXViewportView is not found or when the Diagnostics window cannot be opened.
The indication that the DXEngineSnoop is attached to the target process is that the title of the main window of the target process should get additional "(with DXEngineSnoop)" text.
In case the DXEngineSnoop is attaching to an application with different version of DXEngine, it is possible that the Visual Studio will stop on exception that some method or property is not implemented.
Most of such exception are handled inside DXEngineSnoop so you should be able to click continue in Visual Studio.
When the DXEngineSnoop is able to change the title of the window (it adds "(with DXEngine Snoop)" text),
the window is showing the 3D scene, but the Diagnostics window is still not show, then the DXEngineSnoop probably cannot find the
DXViewportView (this can be also seen from log file where the log contains "DXView not found" - see below).
The reason for this is usually that the hierarchy of the objects is created in a way that cannot be recognized by the DXEngineSnoop.
This can be solved with manually setting the "DXView" property to Application's Properties. This can be done with the following code:
Application.Current.Properties["DXView"] = mainDXViewportView;
Make sure that DXEngineSnoop is started after this property is set.
If the Diagnostics window is still not shown, it is possible get detailed information about the attaching process with enabling logging.
The easiest ways to enable logging is to start DXEngineSnoop and
This can be done with starting the DXEngineSnoop with "/log:fileName" (fileName must be specified with full path) startup parameter.
This will log information to Visual Studio Output window and also to the specified file name.
After getting the log file name, please send it to support@ab4d.com email.
The DXEngineSnoop is installed with the evaluation or commercial installer into the Ab3d.DXEngine\Tools folder.
It can be also downloaded with using the following button: