Ab2d.ReaderSvg is a class library that can be used to read svg and svgz (compressed
svg) files and import its elements into any WPF application.
The Ab2d.ReaderSvg can accurately read shapes defined in svg file, their strokes, fills and other properties.
It can read all types of gradients, patterns and markers (line starting and ending shapes).
This gives the designers free hands to define their drawings in almost any vector drawing application, save them into svg file and the application developers can than use the drawings in their WPF applications.
The elements in svg file can be converted into shapes or geometry objects.
The shapes (Canvas, Ellipse, Path, etc.) are great because they can be simply modified
and mouse events can be assigned to them. Geometry objects (GeometryDrawing, PathGeometry,
etc.) are a lightweight version of shapes that have much better performance and
lower memory usage but are harder to manipulate. Therefore graphics objects are
ideal for complex drawings. And what is more the read geometry can be further optimized
for even better performance.
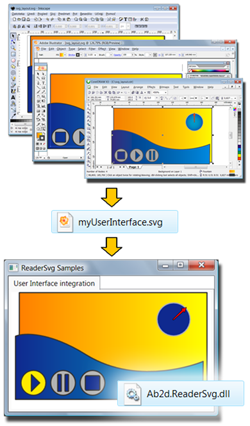
For example the following line of XAML is all that is needed to show birthday_cake.svg:
<ab2d:SvgViewbox Source="samples/birthday_cake.svg"/>
Features:
- Read svg and svgz (compresses svg) files.
- Preserve objects hierarchy.
- Get name of the objects from id attribute or from title element.
- Read embedded bitmap images.
- Read shapes with their properties.
- Read linear and radial gradients.
- Read patterns and convert them into VisualBrush.
- Read marker elements - line starting and ending shapes (arrows, etc.)
- Read use and symbol elements (also used for embedded fonts).
- Read clipPath elements.
- Read elements in svg file as Shapes or as Geometries (better performance).
- Optimize read Geometry for better performance.
- Optionally convert text into Path.
- Automatically resize the read elements.
- Get progress report when reading svg file.
- GetXaml method to get formatted and valid XAML of the read objects.
- Read custom properties and layers data from svg files created in Microsoft Visio.
- Included SvgViewbox and SvgDrawing controls that can be used in XAML.
- Optimize hierarchies of read objects with optimizing the groups or completely flattening the hierarchy.
- True transform transforms the shape data with changing the actual values instead of using RenderTransform or LayoutTransform.
Samples
Ab2d.ReaderSvg comes with many samples that shows many new possibilities that are opened with the library. There are WPF and Silverlight sample applications. The following screenshots show some of them:
ResourceDictionaryWriter
The prefered way of storing cliparts in WPF is to use ResourceDictionaries. To simplify
creating ResourceDictionaries from svg files there is a ResourceDictionaryWriter
sample application. It is available with full source code, so it can be fully customized.
More about usage of ResourceDictionares can be found on the Microsoft's MSDN.
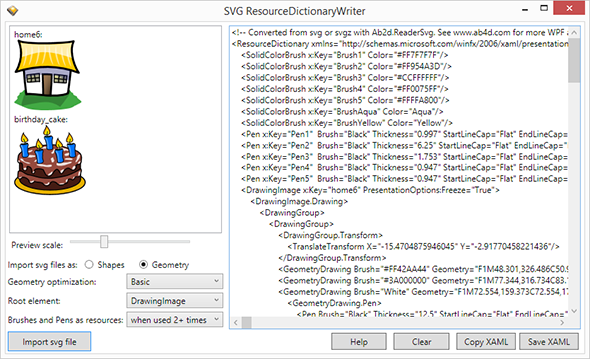
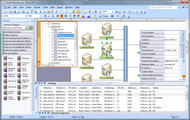
The following screenshot shows SVG ResourceDictionaryWriter application with three svg files
added to the ResourceDictionary (xaml of ResourceDictionary can be seen on the right):
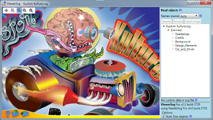
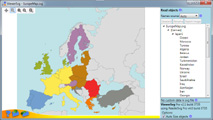
ViewerSvg
ViewerSvg is a WPF application that is using Ab2d.ReaderSvg and can be used to convert svg files to XAML.
ViewerSvg features:
- Possibility to read svg objects as Shapes (for easier manipulation) or as Geometry objects (for better draw performance).
- Optimize hierarchies and transformations to convert complex hierarchies with transformations into simpler objects.
- Read data from custom properties that are attached to elements and export the data as xml serialized DataTable (only for svg files created in Microsoft Visio).
- Additional optimization of Geometry objects to further improve drawing performance.
- Using TrueTransform to change size and position of read objects by changing the actual shape data (without adding Transformation to root object).
- Possibility to convert texts into PathGeometry.
- Option to automatically size the read objects so that only the svg content is get without the whole document defined in root svg element.
- Preserve element names - name can be read from id attribute or from title element.
ViewerSvg is not available from NuGet package. It can be installed by using an evaluation version installer (download from Downloads)
or by installing the commercial version of Ab2d.ReaderSvg (download from User Account web page).
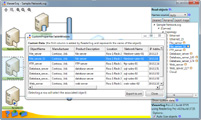
ViewerSvg screenshots:
| ViewerSvg user interface: |

|
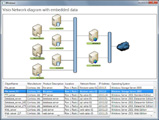
| Creating svg file with data in Microsoft Visio and opening it in ViewerSvg and in our WPF application: |
|
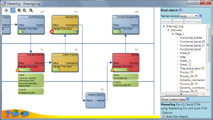
| Various svg files opened in ViewerSvg: |
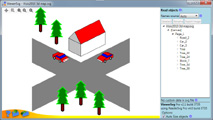
|
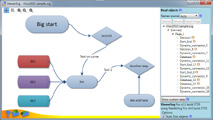
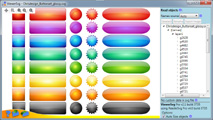
|
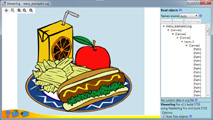
|

|
Versions history information
To see the development history of Ab2d.ReaderSvg, check out: